What you’ll learn
- Do my old Console links still work?
- What does first-token timing actually measure?
- Where do I top up when a conversation runs out of balance?
- Can I compare first-token timing across different models?
TokenLab Console stopped feeling like a dashboard to us when coding-assistant mode and AI-application mode merged into one work surface. In our pipeline, the request, the reply, and the account state around them now sit together. That removes a context switch from every session, and it changes how we read a slow reply.
Key Takeaways
- Coding-assistant mode and AI-application mode now both live in TokenLab Console; the two older entry points are merged into it.
- Existing links still resolve, and previous conversations are still there. There is nothing to migrate by hand.
- Replies stream as the model generates them instead of appearing only at the end. The interface shows first-token timing.
- First-token latency is a recorded request signal (
ttft_msin the request log), not an interface-only decoration. - When the balance runs low mid-conversation, the top-up entry is next to the conversation instead of in a separate billing page.
- The Console's model choice follows the public catalog; check the model directory for current options. Current catalog examples include Claude Sonnet 5 and DeepSeek V4 Pro.
What changed in TokenLab Console, and what did not
The change shipped as two changelog entries. Console convergence (2026-08-04) moved the two older entry points into one Console. Console chat streaming (2026-08-18) added streaming to chat. The two changes landed a month apart, so teams that missed the first entry still get the second one for free.
This is a surface change, not a behavioural one. Model calls, keys, and billing are unchanged. Old links keep working, and existing conversations were preserved across the merge. There is no manual migration step.
The convergence step is about entry points, not model access. The streaming step is about how a reply appears, not what tokens are billed. That matters because a product surface change can hide a behavioural change, and this one did not. Coding-assistant mode and AI-application mode now share one place, so the first decision in a session is no longer about which entry point to open.
If your team has runbooks that point to the old entry points, update the labels when you can. The old links still resolve, so the runbook will not break. The Console is the place to bookmark for new work. When you pick a model in either mode, the choice follows the public catalog, so check the model directory. Current catalog examples include Claude Sonnet 5 and DeepSeek V4 Pro.
Streaming in TokenLab Console changes how you read a session
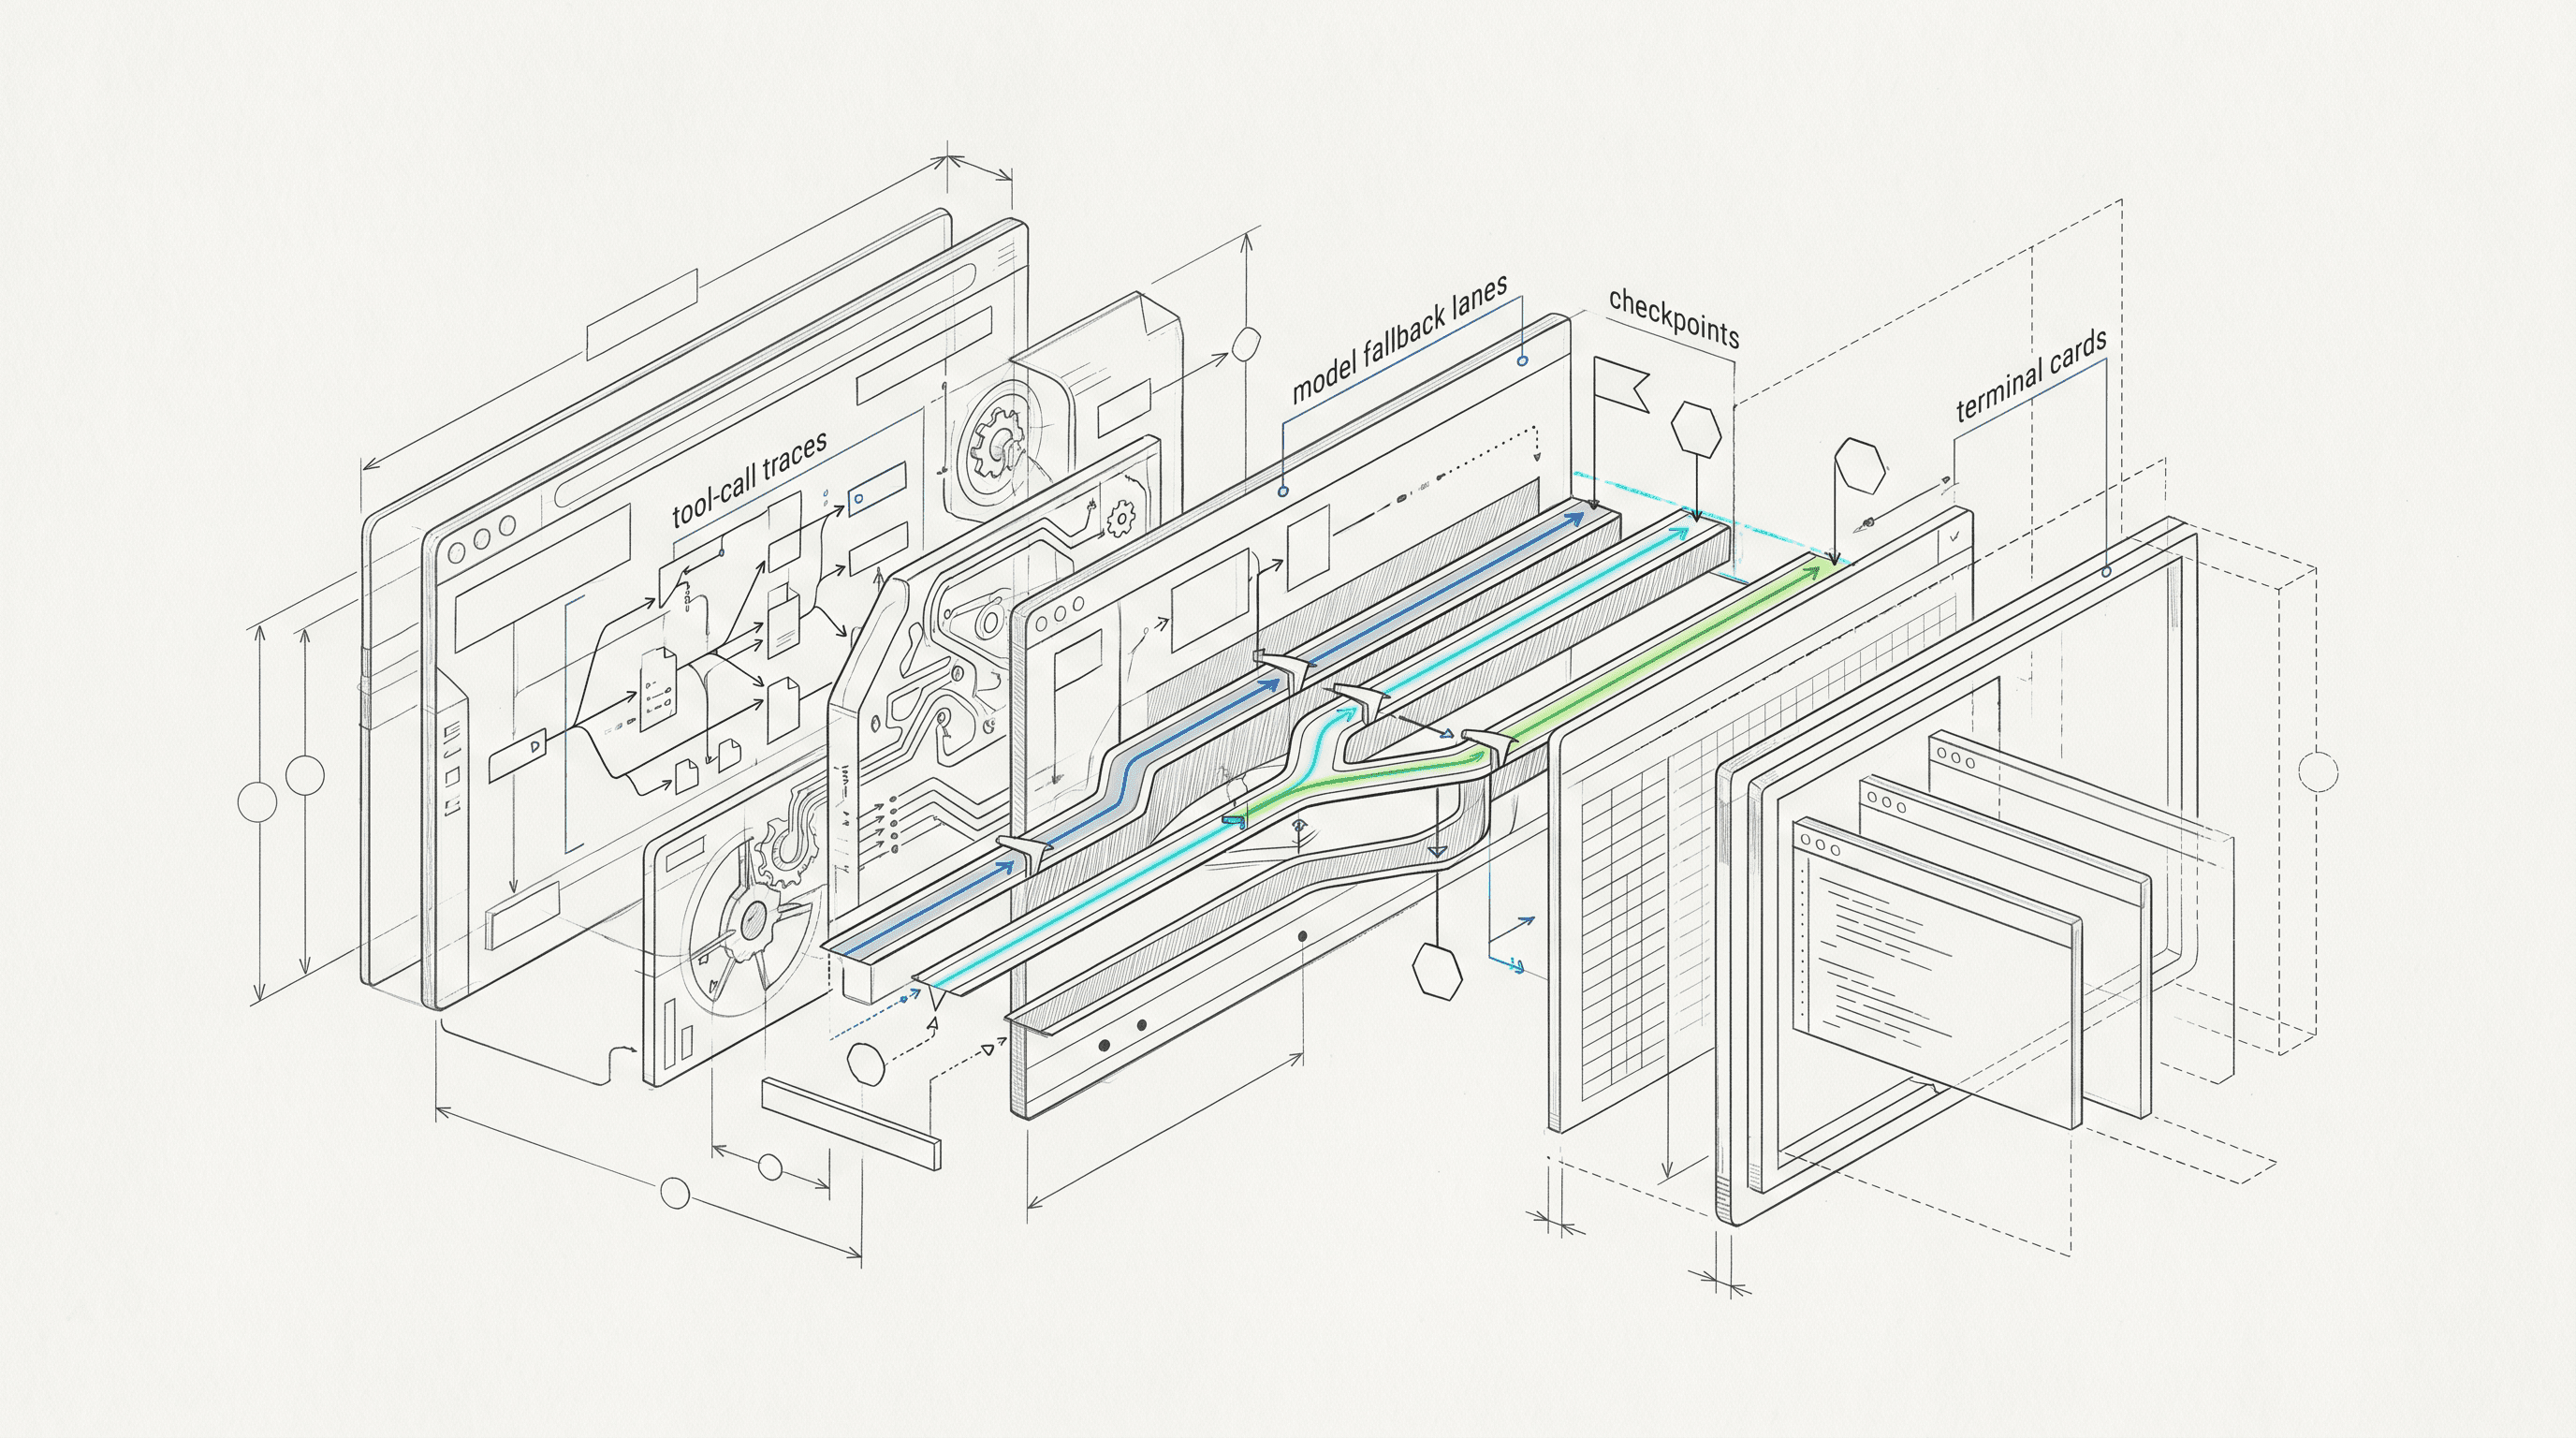
Streaming changes the moment you know something is happening. In our pipeline, the Console gateway client builds streaming chat requests, and the reply renders incrementally. The interface shows first-token timing, so you can see when the model starts to answer. The Console also records that signal as ttft_ms, an optional column in the request log.
First-token timing tells you when the first token arrived, while total latency tells you when the whole reply finished. Those are different questions, so when a reply feels slow, check ttft_ms first. If the first token is late, the wait is before generation. If the first token is early and the reply drags, the wait is in the rest of the stream.
When we watch a slow session, we compare ttft_ms with the rest of the request evidence instead of guessing from the spinner. Request-level evidence is scoped to the organization and covers routing, billing state, cache state, and the model and key context behind a request. The Console exposes the same request record you would otherwise dig out of logs.
A worked example of reading the first-token signal:
# The Console request log exposes `ttft_ms` as an optional column.
# 1. Filter the request log to the request you are checking.
# 2. Read `ttft_ms`.
# 3. Compare `ttft_ms` with the request's total latency in the same row.
For the exact streaming request shape, use the current TokenLab API docs. A copied request example with invented fields would be less useful than the docs page that owns those names.
Streaming does not change what you are billed for, because the same tokens are produced but they are visible as they arrive. Because replies now stream, an interrupted session still shows the partial reply instead of nothing. That changes how you diagnose a mid-session failure. For long-running jobs that a chat stream does not cover, see the async image generation tasks guide.
How to verify a slow session without guessing
Start with the request log, not the spinner, because the ttft_ms column tells you when the first token arrived. If that number is high, the model had not started to answer yet. If that number is low, the model started early and the remaining stream took the time. That split keeps you from blaming the wrong part of the path.
The request record is scoped to your organization. It includes the route that served the request, the billing state, the cache state, and the model and key context. Those fields sit together, so you can read the session as one event rather than stitching together separate pages. The same request record is available in the dashboard, which helps when comparing the Console view with account-level data. The Request Console guide explains where that evidence lives.
For example, if the first token is early and the reply drags, ttft_ms is not the main signal, because the rest of the stream is. You can look at the route and cache state in the same request record. You can check whether the request hit a cache or went to the model. You can see which key and model context were attached.
None of that tells you the whole story on its own, but together they give you a place to look. When we watch a slow session, the request log has the details we need. We compare ttft_ms with the other request-level evidence before we draw a conclusion.
The same workflow helps when a request fails or pauses because of balance. The request record includes billing state, so the failure is not a mystery. The top-up entry is next to the conversation, so the fix stays in the same window. You do not need to leave the session to find the next step, so you can top up and then continue.
If the balance is fine, you can move on to routing, cache state, or model choice. The point is to read the request-level evidence in order. First ask when the first token arrived, then ask what route served it, and then ask what else the record says about billing, cache, model, and key context. That order is simple, and it matches the way the Console presents the data.
Limitations
Streaming shows progress, not throughput, because a stream can start quickly and still take a long time to finish. A fast first token does not prove the whole request is fast. First-token timing also depends on the model and the route. Compare within a model rather than across models.
A change in ttft_ms may reflect routing, cache state, or model choice, not just the prompt. Treat ttft_ms as one signal in the request log. Pair it with the other request-level evidence before you draw a conclusion. This is a surface for reading a session, not a benchmark for ranking models.
The Console does not turn a chat stream into a job runner. If you have a long-running image task, use the async image generation tasks guide instead of holding a chat stream open. The streaming surface is for replies that arrive token by token. The async guide is for work that runs outside a chat reply.
Also remember that request-level evidence is scoped to the organization, which ties a request to the account context around it. It also means you should not treat one request as a global benchmark. The record covers routing, billing state, cache state, and model and key context for that request. It is a strong place to start a diagnosis. It is not a ranking of providers or models. When we compare sessions, we compare within the same model and the same route family, which keeps the comparison honest.
FAQ
Do my old Console links still work?
Yes. Old links keep working, and existing conversations were preserved across the merge. There is nothing to migrate by hand. If you bookmarked a Console page, it still resolves.
What does first-token timing actually measure?
It measures when the first token arrives in a streaming reply, and the Console surfaces it in the interface and records it as ttft_ms, an optional column in the request log. It does not measure total latency or throughput.
Where do I top up when a conversation runs out of balance?
Use the top-up entry next to the conversation, which appears when the balance runs low mid-conversation, so you can handle the balance without leaving the session. The billing page in the dashboard remains the place for broader account work.
Can I compare first-token timing across different models?
No, not as a clean comparison. First-token timing depends on the model and the route, so compare within a model rather than across models. Use ttft_ms as one request-level signal, not a model ranking.
Create an API key and run one session in the new Console at the dashboard.
Sources
- TokenLab changelog: Console convergence and streamingSources checked 2026-09-19
- TokenLab dashboardSources checked 2026-09-19