What you’ll learn
- How do I find a failed request without a request ID?
- Why would a request show billed when the client reports an error?
- What does a cache miss tell me in the inspector?
- Can I share a request link with a teammate?
- When should I switch from the console to usage exports?
A failed AI API call rarely announces itself clearly. You get a status code, maybe an error string, and a support channel where someone asks 'what was the request ID?' If you do not have it handy, the investigation stalls before it starts. We built the TokenLab Request Console to close that gap by putting request-level detail into one dashboard view. It shows model, key, cache state, billing state, timing, and a redacted payload preview. In our pipeline, we treat the request ID as the first lookup key.
Key Takeaways
- The TokenLab Request Console is a request-level debugging surface inside the TokenLab API dashboard, not a billing report.
- Every request has an ID you can search directly. You can deep-link to a specific request with
requestIdin the URL. - The console shows routing, billing state, cache state, model/key context, and redacted payload previews for recent requests.
- Access is scoped to your organization and governed by dashboard membership permissions — teammates see what their role allows.
- For single-incident debugging, use the console. For batch cost review across time ranges, use usage exports instead.
What the TokenLab Request Console Is
You reach it at /dashboard/api?tab=requestConsole, inside the API section of the TokenLab dashboard. The API dashboard itself lives at /dashboard/api. The console is built around one premise: when a request fails, the fastest fix comes from having its full context in front of you, not from guessing based on an error message alone.
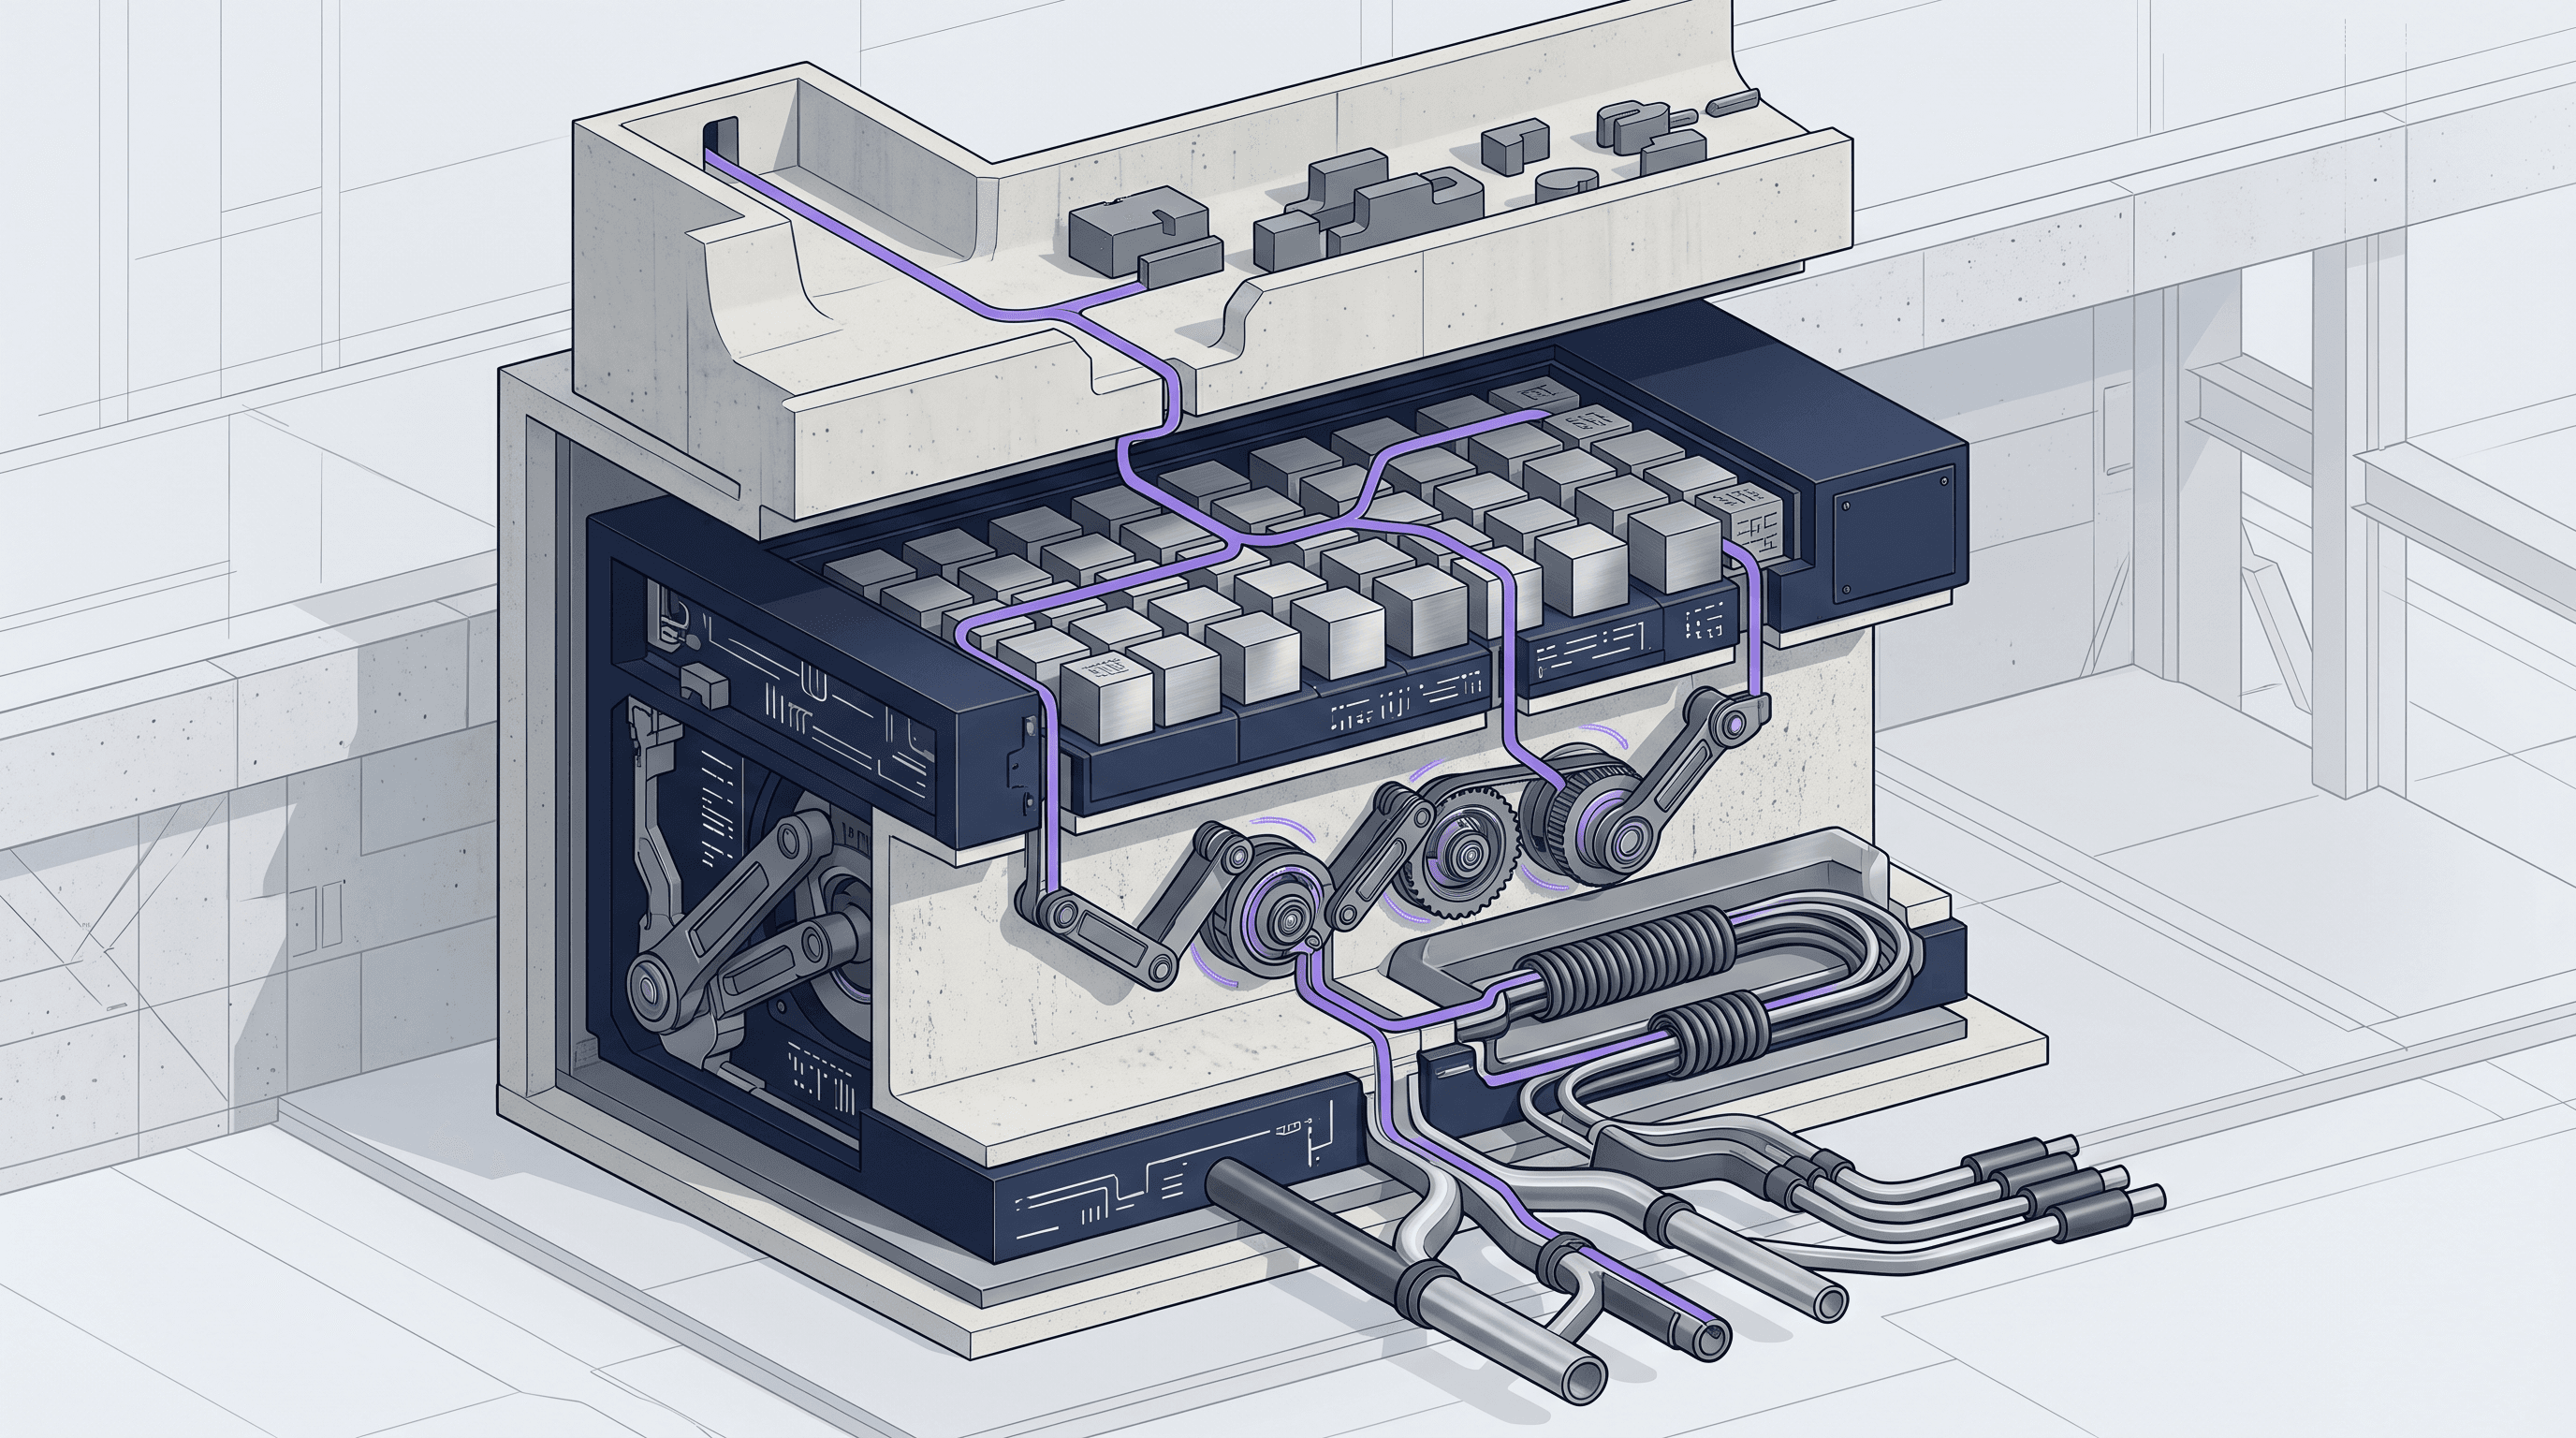
The dashboard copy describes the console as an inspector for recent requests, covering routing, billing, request/response body, and model vendor context. We see it break down into a few working sections.
List view. A filterable table of recent requests. This is where you start when you do not yet have a specific request ID. You are scanning for the failed or unusual call.
Inspector panel. Once you select a request, the inspector opens with the full detail: which model served it, which API key was used, whether it hit cache, and what the final status was.
Error context. If the request failed, the console surfaces the error information tied to that specific call. You are not cross-referencing a separate error log.
Route and billing state. Shows how the request was routed and whether it was billed, pending, refunded, or failed. Those four states matter most when a customer asks 'was I charged for that error?'
Payload preview. Request and response bodies are shown as redacted previews when available, giving you shape and structure without exposing raw secrets in the body.
Model vendor and model key context. Which provider and which specific model handled the call. This is useful when you run multiple models behind one integration and need to confirm the right one was invoked.
None of this requires you to build your own logging pipeline on top of the API. It is already surfaced per organization, filtered by dashboard membership permissions, so teammates with appropriate access see the same request data you do.
What to Inspect First
When an API call fails, there is a natural order to check things in. Jumping straight to 'is the model down' before confirming the request even reached the right endpoint wastes time.
The five-field triage
| Check | What it tells you |
|---|---|
| Request ID | Confirms you are looking at the exact call in question, not a similar one |
| Status | Billed, pending, refunded, or failed — tells you if this is a cost question or a technical one |
| Model | Which model actually served the request (useful if you route across multiple models) |
| Cache state | Whether a prompt cache hit or miss changed cost or latency |
| Key source | Which API key was used, useful when multiple keys or environments share an integration |
Start with the request ID. If you have it from a client-side log, a support ticket, or an error report, use the deep-link pattern:
/dashboard/api?tab=requestConsole&requestId=%3Crequest_id>
That opens the inspector directly on the request in question, skipping the list view entirely. It is the fastest path when someone hands you an ID and asks 'what happened here.'
If you do not have a request ID yet, the console's filters let you narrow by model, time range, prompt cache state, key source, and status. For example, when a request fails, filter by 'failed' status within the last hour, then scan the list for the specific call a user is asking about.
Reading the status field correctly
The four states — billed, pending, refunded, failed — answer different questions:
- Billed means the call completed and consumed credits. If a user reports an error but the request shows billed, that is worth flagging separately. It suggests the failure happened on the client side after a successful response.
- Pending means the request is still in flight or awaiting settlement. Do not treat this as a failure prematurely.
- Refunded means TokenLab reversed the charge, typically tied to a failure on the provider or routing side.
- Failed means the call did not complete successfully and was not billed.
Knowing which of these applies before you escalate saves a round of back-and-forth with support.
Confirming the model and cache state
If you are running requests against models like Claude Sonnet 5, DeepSeek V4 Pro, or Gemini 3.5 Flash through a shared integration, confirm the console shows the model you expected. A misconfigured client, a stale environment variable, or a routing override can send traffic to the wrong model without an obvious client-side error.
Cache state matters for two reasons: cost and latency. A cache miss where you expected a hit usually means the prompt prefix changed, even subtly. Look for a timestamp, a reordered field, or an extra whitespace character. The console's cache-state filter lets you compare hit and miss requests side by side.
How the TokenLab Request Console Works with Usage Exports
The Request Console and usage exports solve different problems, so it helps to be explicit about the boundary. The console is built for single-request investigation: one call, one error, one billing question, answered in the inspector panel. It is what you open when a specific request fails and you need to know why, right now.
Usage exports are built for aggregate review: spend across a time range, breakdowns by model or key, and the kind of reporting you would hand to a finance stakeholder or use for a monthly reconciliation. If you want to answer 'how much did we spend on DeepSeek V4 Pro last week,' that is an export question, not a console question. See the TokenLab dashboard usage exports guide for that workflow.
In short: console for incidents, exports for totals. Some teams use both in sequence. An export surfaces an anomaly in aggregate spend, and the console is where you drill into the specific requests that caused it.
A Practical Debugging Routine
Ad hoc debugging turns into guesswork under pressure. A repeatable routine keeps incidents from becoming longer than they need to be.
Checklist: when a request fails
- Get the request ID. From your client logs, error response, or a user report. If you do not log request IDs on your end today, start now. It is the fastest lookup key you have.
- Open the console with the deep link. Use the
requestIdquery parameter to jump straight to the inspector. - Check the status field first. Billed, pending, refunded, or failed. This frames the rest of the investigation.
- Confirm the model that actually served the request. Compare it against what you expected to send.
- Check cache state. A cache miss where you expected a hit can explain unexpected latency or cost.
- Check the key source. Confirm the right API key and environment were in use, especially in staging-vs-production setups.
- Read the error context and route information. This is usually where the actual root cause becomes visible.
- Review the redacted payload preview. Confirm the request shape matches what your client sent. Malformed parameters often show up here before they show up anywhere else.
- Cross-reference with the API reference if needed. The TokenLab chat completions API reference at
https://docs.tokenlab.sh/api-reference/chat/create-completiondocuments expected request and response shapes. Use it to confirm whether a payload was malformed on the client side. - If it is a pattern, not a one-off, switch to usage exports. A single failed request is a console problem. Ten failed requests over an hour is a pattern worth exporting and reviewing in aggregate.
Following this order — ID, status, model, cache, key, error, payload — keeps you from skipping past the field that actually explains the failure.
FAQ
How do I find a failed request without a request ID?
Use the list view filters in the TokenLab Request Console. Narrow by model, time range, prompt cache state, key source, and status. For example, filter by 'failed' status within the last hour, then scan for the call a user is asking about. Once you find it, open the inspector and copy the request ID for future logs.
Why would a request show billed when the client reports an error?
Billed means the call completed and consumed credits. If a user reports an error but the request shows billed, the failure likely happened on the client side after a successful response. Flag that case separately because it points to a different fix path than a failed or refunded request.
What does a cache miss tell me in the inspector?
A cache miss means the request did not hit prompt cache. That matters for cost and latency. A miss where you expected a hit usually means the prompt prefix changed, even subtly. Check for a timestamp, a reordered field, or an extra whitespace character.
Can I share a request link with a teammate?
Yes, if their dashboard membership permissions allow it. Request data is scoped to your organization. Use the deep-link format /dashboard/api?tab=requestConsole&requestId=<request_id> to open the inspector directly. Teammates see what their role allows.
When should I switch from the console to usage exports?
Switch when the issue is a pattern, not a one-off. A single failed request is a console problem. Ten failed requests over an hour is a pattern worth exporting and reviewing in aggregate. Use exports for spend across a time range, breakdowns by model or key, and monthly reconciliation.
Sources and Freshness
- TokenLab Request Console —
/dashboard/api?tab=requestConsole— observed 2026-07-09 - TokenLab Chat Completions API reference —
https://docs.tokenlab.sh/api-reference/chat/create-completion— observed 2026-07-09 - TokenLab Dashboard Usage Exports —
/blog/tokenlab-dashboard-usage-exports— observed 2026-07-09 - TokenLab public model directory —
/models— observed 2026-07-09 - TokenLab API key dashboard —
/dashboard/api— observed 2026-07-09
Model examples referenced (Claude Sonnet 5, DeepSeek V4 Pro, Gemini 3.5 Flash) reflect the current model SSOT as of 2026-09-19. The source snapshot for this console note was observed 2026-07-09; the original model SSOT date in the source was 2026-07-07.
Next Steps
If you currently debug AI API failures by grepping through client-side logs and cross-referencing a separate billing dashboard, the Request Console removes a step from that loop. The console lives at /dashboard/api?tab=requestConsole. The API key dashboard is at tokenlab.sh/dashboard/api. The chat completions request/response shape is documented at https://docs.tokenlab.sh/api-reference/chat/create-completion. For aggregate spend review, use usage exports. For model pricing and context window details, see the model directory. Open the console and locate a recent failed request by ID.
Sources
Prices checked 2026-07-09
- TokenLab Request ConsoleSources checked 2026-07-09
- TokenLab Chat Completions APISources checked 2026-07-09
- TokenLab Usage ExportsSources checked 2026-07-09
- TokenLab model directorySources checked 2026-07-09